About Me
Hello! I’m results-driven and skilled Data Analyst with a passion for turning data into meaningful insights, I help businesses make informed decisions by transforming raw data into actionable insights. Proficiency in various data analysis tools, such as Excel, Power BI, Tableau, and SQL . I specialize in creating data-driven solutions that optimize business performance across various industries and optimizing decision-making processes for organizations. My focus lies in analyzing complex datasets and designing interactive dashboards providing clear, actionable reports and recommendations tailored to each client's unique needs.

Education

Egypt Ministry of Communications and Information Technology -DEPI
-
Microsoft Power BI Data Analyst (10/2024-3/2025)
Data Collection, Cleaning, and Analysis by Excel, Power BI, Tableau, and SQL using Power query, advanced DAX programming, dashboard development, and data governance principles.

Faculty of Engineering, Alexandria University
-
BSc. Of Chemical Engineering (2012-2017)
Experience
Freelance Project Data Analyst & BI Analyst
-
Conducted data collection, cleaning, and analysis for construction and business projects.
-
Developed dashboards and performance reports to track project timelines, budgets, and KPIs.
-
Supported stakeholders with data-driven insights to enhance decision-making and mitigate risks.
-
Provided recommendations to improve efficiency, resource allocation, and project delivery outcomes.

Senior Business Analyst & Product Owner | 52nd Solution
-
Create and maintain project backlogs and develop the product strategy based on customer feedback and business goals
-
Own product stream development lifecycle: from discovery to execution and monitoring in production
-
Provide visibility of backlog management, ensuring transparency across the business
-
Articulate features, detailed stories, and acceptance criteria
-
Develop digestible features and independent stories for efficient and value-driven delivery
-
Actively participated as a member of an Agile development team, contributing to all Scrum ceremonies.
-
Collaborate daily with technical teams to ensure proper implementation of features and fixes.
-
Prioritize features and enhancements based on impact, value, and urgency.
-
Act as the internal customer representative and ensure the product is strongly aligned with the customer's line of business.

Data Analyst & Business Intelligence Analyst | Nawa Company (Retail and Supply Chain Analysis Field)
-
Conducted retail data analysis covering key metrics and identified critical areas for improvement, leading to data-driven decision-making.
-
Enhanced sales tracking and target achievement analysis to align with business targets
-
Developed analytical reports, providing actionable insights for retail operations.
-
Provided data-driven insights to improve inventory management and supplier performance.

Business Analyst & Technical Writer | Fanos
-
Collaborate with stakeholders to gather and analyze business requirements and translate them into clear, actionable solutions aligned with business goals.
-
Developed and maintained high-quality documentation, including user manuals, API guides, process flowcharts, and diagrams to support documentation.
-
Create Business Requirement Documents (BRD), support UAT processes, and streamline reporting structures.
-
Write user stories to capture user needs and enhance the development process to improve process efficiency and overall business performance.
-
Prioritize based on business value and needs, ensuring the development team clearly and easily understands requirements.
-
Generated quick reports to deliver key insights into departmental performance and efficiency.
Certification
Data Analytics- Microsoft Power BI Engineer

Data Science & Analytics - HP LIFE

Data Analytics - EYouth

Technical Skills
Data Analytic Data Visualization Tools
-
Microsoft Excel
-
Google Sheets
-
Power BI
-
Tableau
-
Python
-
SQL
Data Analytic Methods
-
EDA
-
Data Cleaning & Preprocessing
-
DAX
-
Power Query
-
Storytelling
-
M- Language
-
ETL
-
Descriptive analysis
-
Data Modelling
-
Statistical Analysis
-
Report Generation & Dashboard Creation

Previous Projects
Atlas Labs' HR Analysis


This dashboard comprehensively analyzes key HR metrics, enabling organizations to understand employee trends, track performance, and reduce attrition rates.
Key Highlights:
-
Employee Overview – Gain a clear view of workforce distribution.
-
Attrition Rate Analysis – Identify factors driving employee turnover.
-
Demographics Insights – Understand workforce diversity and trends.
-
Performance Metrics – Evaluate productivity and key performance indicators.
-
Departmental Analysis – Assess team performance and optimize HR strategies.
By leveraging data analytics and BI development, I transformed raw HR data into actionable insights, empowering companies to enhance employee retention and workforce efficiency.
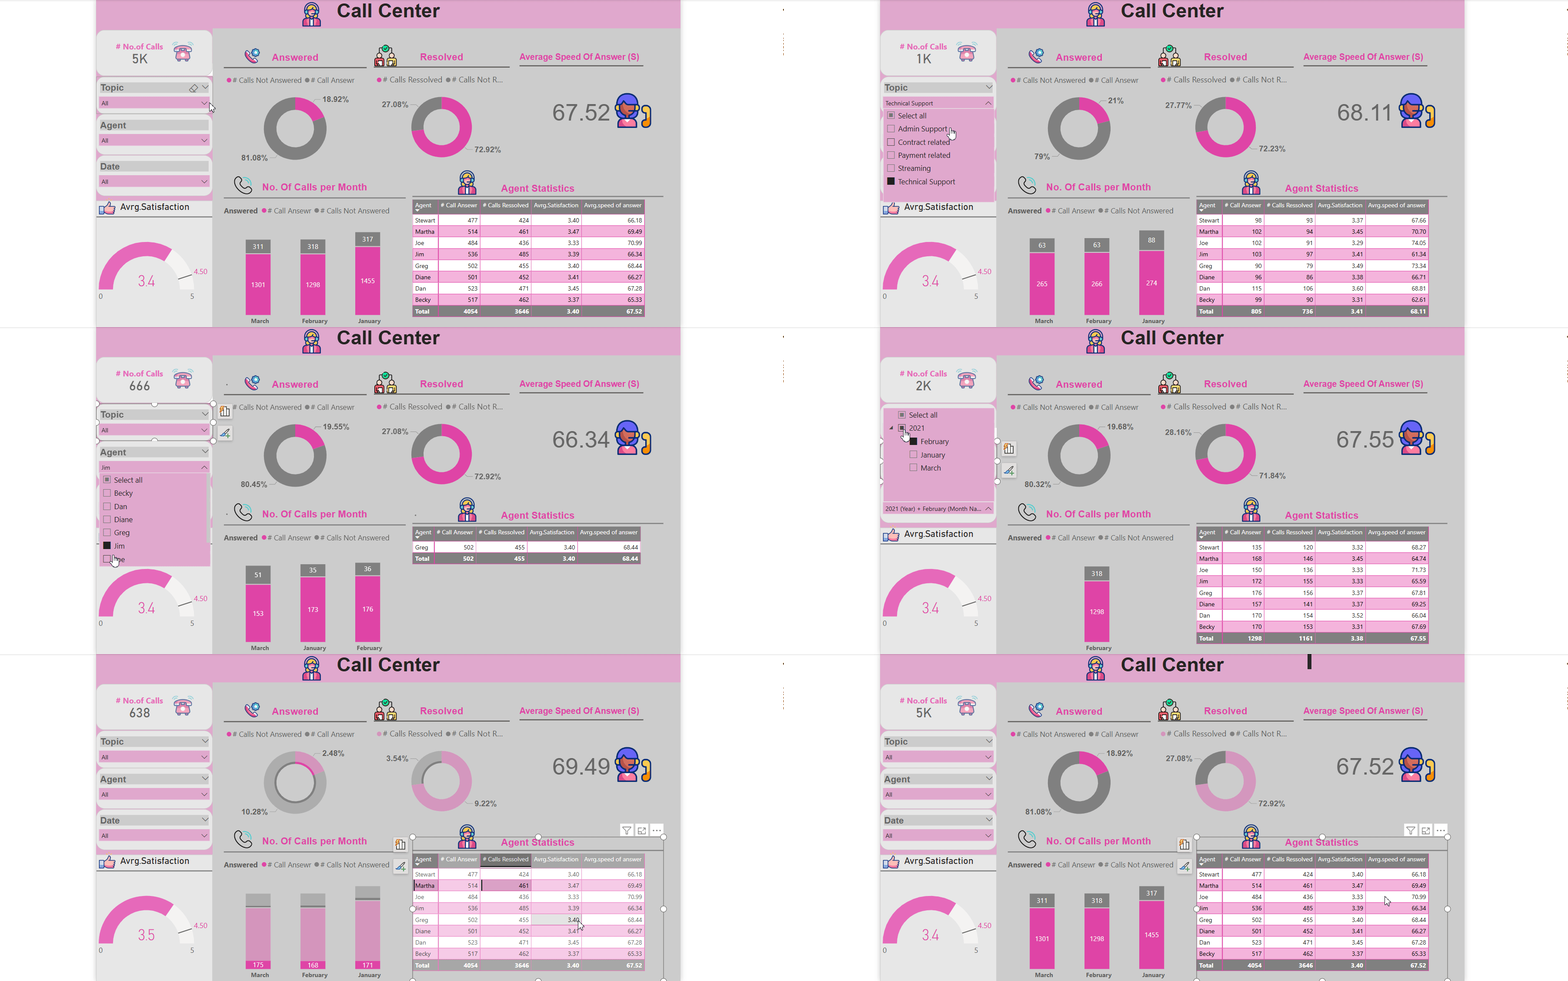
Call Center Performance Analysis

The dashboard was designed by Power BI to provide management with an instant and comprehensive analysis of call center performance, helping to enhance service quality and make data-driven
-
Total Calls Answered & Abandoned
-
Speed of Answer
-
Call Length & Call Resolution
-
Overall Customer Satisfaction (CSAT)
Supermarket Sales Analysis


The dashboard was designed by Power BI
This project provides a comprehensive view of the supermarket sales performance for the first quarter of the year, allowing us to easily identify trends and improvement opportunities.
It provided valuable insights into:
Total sales, profits, orders, costs, and average revenue per order.
Key analytics:
1- Customers: Trends in purchasing behavior by age, gender, and type
2- Products: Best and least profitable categories, unit cost analysis, and pricing.
3- Time: Purchasing patterns and trends in the first quarter of the year.
4- Total profits during the first three months
5- Sales analysis by customer type, by branch, and by city


That project provides deep insights into the company's performance.
Key Features of the Dashboard:
Comprehensive Performance Overview:
-
Total units sold
-
Operating profit
-
Total sales across all products
Detailed Product Insights:
-
Rate and reviews for each product
-
Sales performance for individual products
Top 10 Best-Selling Products:
-
A ranked list of the top 10 products
-
Interactive tooltips to reveal sales and profit details for each item
Unit Sales by Sales Method:
-
Visual representation of units sold across different sales methods
-
Channel-specific performance insights
Enhanced User Experience:
-
A slicer with product images for easy navigation, making the design feel intuitive and app-like
Advanced Analytics with DAX and Filters:
-
Leveraged DAX formulas for complex calculations
-
Dynamic filters for precise and tailored data views
Purpose of the Work:
-
This project goes beyond analyzing numbers by providing actionable insights that empower businesses to make strategic decisions and gain a competitive edge .
-
Combining data analysis and innovative design, this dashboard ensures an engaging user experience while simplifying data interpretation.


In this project, I conducted an end-to-end analysis of the supply chain to assess performance, identify inefficiencies, and drive improvements that directly impact operational excellence and sales performance. The analysis was divided into six key phases:
1. Supplier Evaluation
Analyzed supplier performance based on:
-
Number of suppliers
-
Average lead time and its variance
-
Total quantity supplied
-
On-time delivery rate
-
Supplier efficiency per supplier
I also evaluated the quantity received on time by product type and tracked order delivery (on time vs. late) to assess supplier reliability. This helped identify high-performing suppliers and areas for procurement improvement to reduce delays and ensure consistent production flow.
2. Production Evaluation
Assessed production operations using:
-
Defect rate
-
Production volume
-
Manufacturing cost
-
Average manufacturing lead time
-
Supplier order quantities
Data was broken down by product type to monitor quality trends, align supplier deliveries with production needs, and reduce manufacturing costs through better planning. This phase helped increase production efficiency while maintaining quality.
3. Inventory Evaluation
Evaluated inventory performance through:
-
Stock availability
-
Stock levels across warehouses
-
Inventory turnover ratio
-
Days Sales of Inventory (DSI)
-
Stock-out rate
Linked inventory levels to sales and production volumes by product type. The goal was to optimize inventory, reduce excess stock, and improve stock availability to meet demand with minimal delays or losses.
4. Order Fulfillment
Analyzed order cycle times and fulfillment efficiency by tracking:
-
Fastest, slowest, and average order cycle
-
On-time delivery rate
-
Order volume per month
-
Fulfillment time by product type
Explored factors affecting order fulfillment and aligned production with order volumes per warehouse. The outcome was reduced delivery times, improved order accuracy, and better customer satisfaction.
5. Shipping & Logistics
Monitored shipping efficiency and cost-effectiveness through:
-
Average shipping times by transportation mode and carrier
-
Shipping cost per carrier
This helped identify the most reliable and cost-effective logistics partners and improve last-mile delivery performance while reducing logistics expenses.
6. Sales Overview
Measured business impact via:
-
Average price
-
Total sales, cost, and profit
-
Profit margin
-
Quantity sold
-
Total number of orders
Also analyzed sales performance by product category, linked it with inventory turnover, and identified high-profit, high-demand products. This connected operational improvements with financial outcomes.
Impact on Sales
The comprehensive improvements across sourcing, production, inventory, fulfillment, and logistics resulted in:
-
Faster lead times and smoother operations
-
Higher product availability
-
Reduced stock-outs and production delays
-
Lower operational costs
-
Better customer experience
This directly contributed to increased sales volume, improved profit margins, and enhanced customer satisfaction.


This project was designed to analyze hospital data to enhance efficiency and improve patient care through data-driven insights.
-
Collected, cleaned, and organized hospital datasets (patient admissions, treatments, and resource usage).
-
Analyzed data to identify patient flow trends, peak admission times, and service bottlenecks.
-
Built dashboards and reports using Google Sheets/BI tools to visualize KPIs.
-
Delivered insights that helped optimize staff allocation, reduce waiting times, and improve patient care quality.

Services
Business Intelligence (Power BI)

I provide comprehensive Business Intelligence solutions, from data visualization to advanced analytics, enabling you to track KPIs, identify trends, and make data-driven decisions.
My tailored BI services support operational efficiency and drive strategic growth for your business.
Data Analysis

I provide comprehensive data analysis services to extract valuable insights and identify patterns within complex datasets, empowering data-driven decision-making. By leveraging advanced tools and techniques, I help you uncover key drivers, customer behaviors, and operational efficiencies, driving growth and innovation.
I provide tailored solutions for various industries, such as marketing, sales, healthcare, retail, and supply chain, and others. My services include data cleaning, KPI tracking, and clear visualizations to support confident decision-making.


